Distributed Tracing
Why is Jaeger unreachable or Kiali showing the error “Could not fetch traces”?
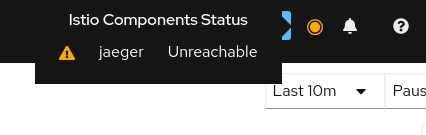
Istio components status indicator shows “Jaeger unreachable”:
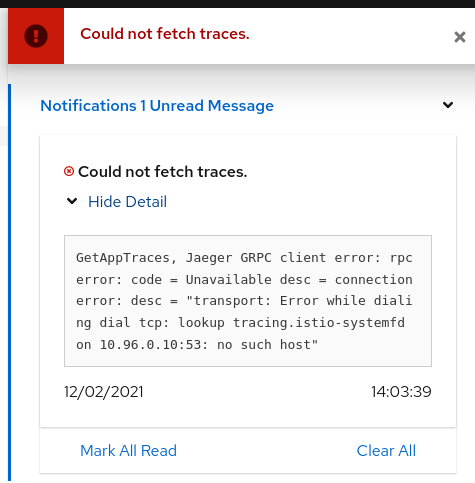
While on any Tracing page, error “Could not fetch traces” is displayed:
Apparently, Kiali is unable to connect to Jaeger. Make sure tracing is correctly configured in the Kiali CR.
      tracing:
        auth:
          type: none
        enabled: true
        in_cluster_url: 'http://tracing.istio-system/jaeger'
        url: 'http://jaeger.example.com/'
        use_grpc: true
You need especially to pay attention to the in_cluster_url field, which is how Kiali backend contacts the Jaeger service. In general, this URL is written using Kubernetes domain names in the form of http://service.namespace, plus a path.
If you’re not sure about this URL, try to find your Jaeger service and its exposed ports:
$ kubectl get services -n istio-system
...
tracing      ClusterIP      10.108.216.102   <none>        80/TCP      47m
...
To validate this URL, you can try to curl its API via Kiali pod, by appending /api/traces to the configured URL (in the following, replace with the appropriate Kiali pod):
$ kubectl exec -n istio-system -it kiali-556fdb8ff5-p6l2n -- curl http://tracing.istio-system/jaeger/api/traces

{"data":null,"total":0,"limit":0,"offset":0,"errors":[{"code":400,"msg":"parameter 'service' is required"}]}
If you see some returning JSON as in the above example, that should be the URL that you must configure.
If instead of that you see some blocks of mixed HTML/Javascript mentioning JaegerUI, then probably the host+port are correct but the path isn’t.
A common mistake is to forget the /jaeger suffix, which is often used in Jaeger deployments.
It may also happen that you have a service named jaeger-query, exposing port 16686, instead of the more common tracing service on port 80. In that situation, set in_cluster_url to http://jaeger-query.istio-system:16686/jaeger.
If Jaeger needs an authentication, make sure to correctly configure the auth section.
Note that in general, Kiali will connect to Jaeger via GRPC, which provides better performances. If for some reason it cannot be done (e.g. Jaeger being behind a reverse-proxy that doesn’t support GRPC, or that needs more configuration in that purpose), it is possible to switch back to using the http/json API of Jaeger by setting use_grpc to false.
If for some reason the GRPC connection fails and you think it shouldn’t (e.g. your reverse-proxy supports it, and the non-grpc config works fine), please get in touch with us.
Why can’t I see any external link to Jaeger?
In addition to the embedded integration that Kiali provides with Jaeger, it is possible to show external links to the Jaeger UI. To do so, the external URL must be configured in the Kiali CR.
    tracing:
      # ...
      url: "http://jaeger.example.com/"
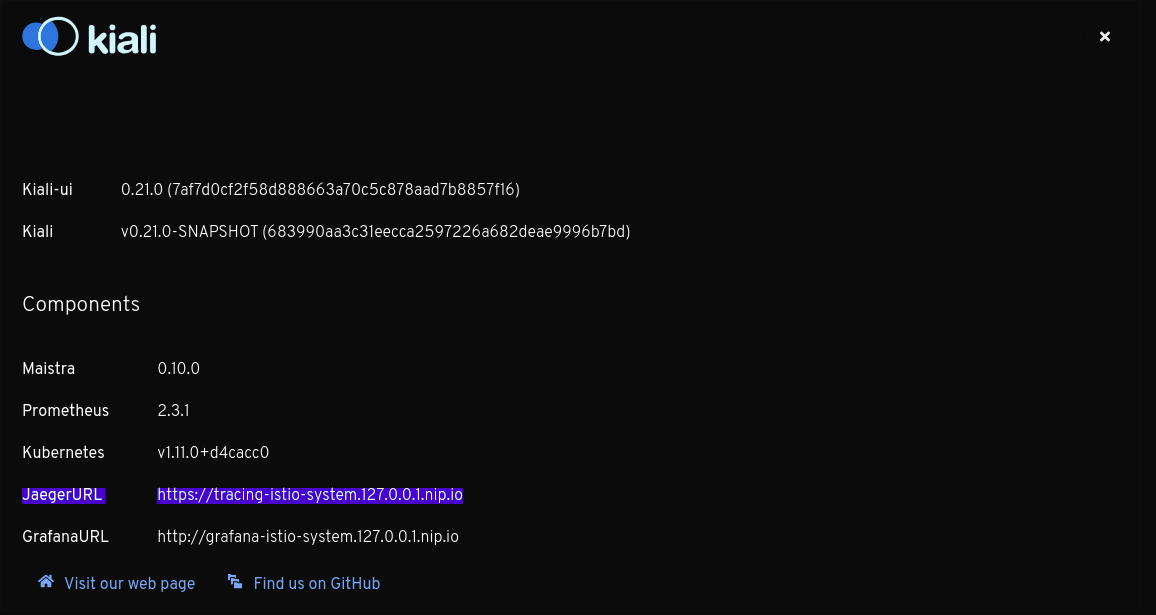
When configured, this URL will be used to generate a couple of links to Jaeger within Kiali. It’s also visible in the About modal:

Why do I see an external link instead of Kiali’s own Tracing page?
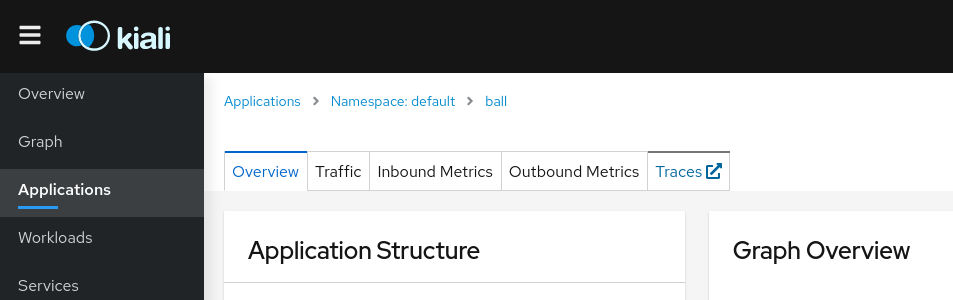
On the Application detail page, the Traces tab might redirect to Jaeger via an external link instead of showing the Kiali Tracing view. It happens when you have the url field configured, but not in_cluster_url, which means the Kiali backend will not be able to connect to Jaeger.
To fix it, configure in_cluster_url in the Kiali CR.
Why do I see “Missing root span” for the root span of some span details on Traces tab?
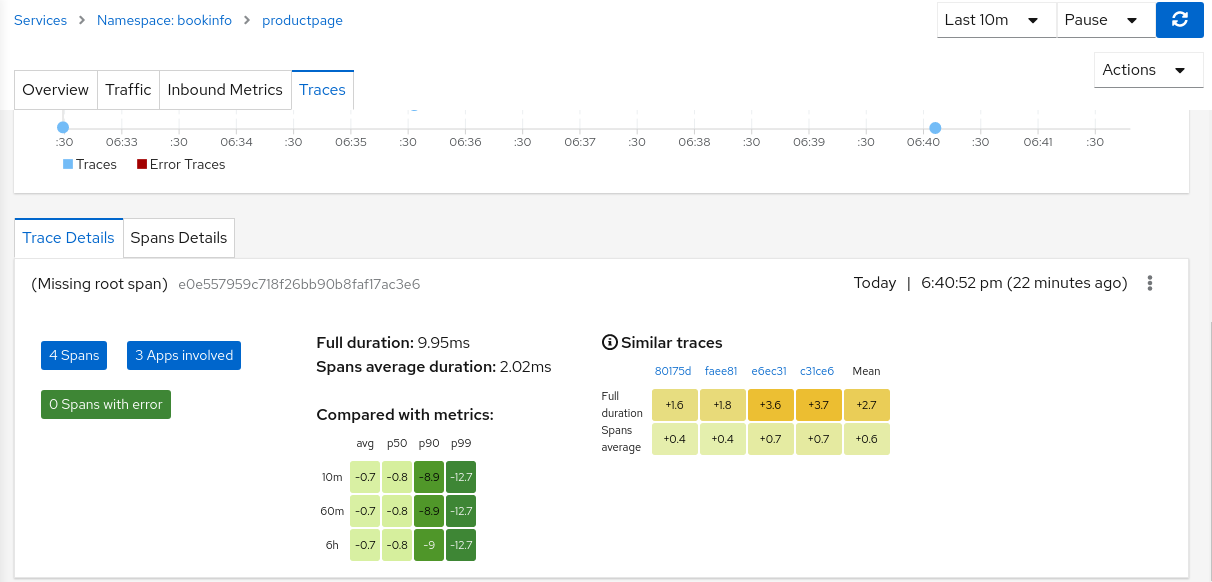
In Traces tab, while clicking on a trace, it shows the details of that trace and information about spans. These details also include the root span information. But for the traces for traffic that is not comming from ingress-gateway, the root span information is not available in Jaeger, thus Kiali is displaying “Missing root span” for those traces' details and tooltips in Traces tab and in Graph pages.